My mock case study of Melbourne city parking
POWER BIEXCELDATA ANALYTICSCASE STUDYPRESENTATIONANALYTICS REPORTMELBOURNEAUSTRALIADATA VISUALISATIONDATA CLEANING
Fynn Burgess
11/4/20232 min read


Introduction and Objectives:
Business use case:
To offer the City of Melbourne valuable insights into parking space availability throughout the city, enabling informed decisions for urban development and future city planning strategies.
Goals/Metrics:
Parking Space Utilization: Analyse the distribution and utilization of parking spaces in different properties to identify the prevalence of various parking types.
Property Attributes Analysis: Understand how property features such as size (number of spaces), and location relate to the property type.
Geospatial Insights: Map property locations and parking spaces to pinpoint hotspots and areas with potential parking concerns.
Data Collection and Preparation:
Clue as explained by the city of Melbourne:
This dataset was collected as part of the City of Melbourne's Census of Land Use and Employment (CLUE). The data presents the number of off-street car parking spaces per property recorded in CLUE as points.
Car parking can be classified as:
• Commercial: Car parking in a publicly accessible, paid parking facility.
• Residential: Car parking in a residential building or property.
• Private: Car parking in a non-residential building that is provided for use by staff, customers, or visitors.
Year surveyed in the dataset:
2002-2021
Visual Representations:
Tableau vs Power BI:
The depth of geographical visuals: Power BI uses street maps to plot the data while Tableau uses a grayscale outline. This analysis being plotted close I needed to be able to distinguish the individual streets and suburbs. I do prefer Tableau because it lends itself to openness and sharing even within the free version.
The good thing about Power BI is that it works well within Microsoft 365 so working with Excel, PowerPoint, and Word is made easier.
The desktop app for Power BI makes quite a bit more sense than Tableau public desktop. I prefer Tableau public online; however, I definitely have found that Power BI works better in the desktop version (despite it missing some features).
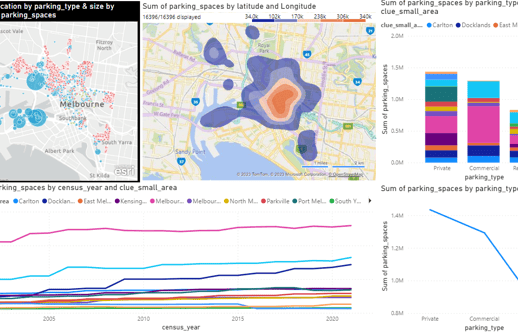
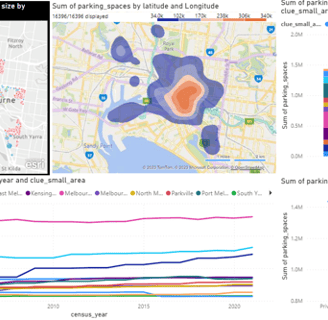
Dashboard:
Power BI service or desktop free doesn't allow you to publish dashboards, you can embed it on a website, however because of the permissions on my account (school) I can't embed the dashboard. If you have a power bi account, you may be able to check it out via the link below. If anything changes, I will update this post.
Here's a screenshot of the dashboard.
Lessons Learned and Future Considerations:
Try to use Tableau as much as possible: Due to the openness of Tableau public in order to share my dashboards on my future posts.
Learning Power BI: This was the first time I used Power BI, the layout was easily transferable from Tableau public. It didn't take me long to create visualisations and importing the data was super easy due to the Microsoft ecosystem. With the data types being correctly imported, unlike Tableau Public which often needs converting.
Excel sheets & their use: In this project, I had just one "working sheet" where I would do all my data cleaning, though when it came to importing data into Power BI it proved to be slightly inconvenient and less streamlined than doing all my separate cleaning actions in separate sheets.
Dataset: https://bit.ly/MelbounreParkingDataset
If you want to get access to my Excel document or to learn more about this mock case study email me: Fynn@fynnburgess.com