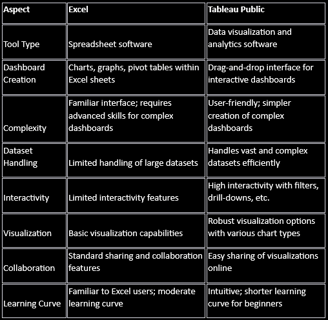

Excel to Tableau
Please be aware that this dataset was created using AI and may not faithfully replicate real-world situations. While it can be utilized for learning purposes, the outcomes derived from it might not align logically or consistently with real-world scenarios. Exercise caution when drawing conclusions or making decisions based on this dataset, as its AI-generated nature could result in data patterns or conclusions that might not align with practical or logical expectations.
This dataset was taken from my mini skills case study available here:
https://fynnburgess.com/working-in-excel
About the dataset:
The dataset contains detailed information on various vehicles, encompassing different manufacturers, models, manufacturing years, vehicle types, prices in Australian dollars (AUD), available stock counts, and yearly sales figures for the year 2022.
Each entry in the dataset includes the following attributes:
· Vehicle ID: A unique identifier for each vehicle.
· Manufacturer: The brand or company producing the vehicle.
· Model: The specific name or model of the vehicle.
· Manufacturer, Model: A combined field indicating both the manufacturer and model.
· Year: The manufacturing year of the vehicle.
· Type: Categorization of the vehicle type, such as Sedan, Hatchback, SUV, Pickup, Coupe, Minivan, Wagon, Van, Convertible, or Minivan.
· Price (AUD): The price of the vehicle in Australian dollars.
· Stock Available: The count of available units in stock.
· Yearly Sales (2022): The number of units sold in the year 2022.
This dataset encompasses a range of vehicles, offering insights into the used dealerships’ diversity, pricing trends, and sales performance for different manufacturers, models, and vehicle types. It's structured to facilitate analysis and exploration of the automotive market landscape for various purposes such as stock research, pricing strategy, or sales performance evaluation. However, it's essential to note that as an AI-generated dataset.